
Table 4.
Top 10 out of 33 genes in module 4 ranked according to their contributions to the module under toxic conditions
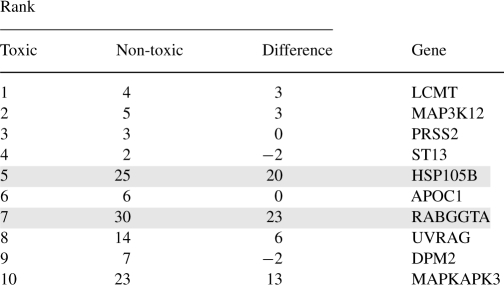 |
The ranking difference was calculated by subtracting the ranking number of the specific gene under toxic conditions from non-toxic conditions. Positive ranking differences indicate bigger ranking numbers and less contribution in non-toxic conditions. The two genes with the highest Difference ranks are highlighted in grey.