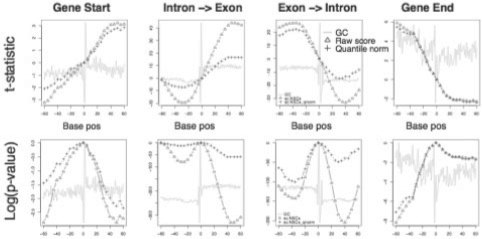
Fig. 2.
Tile score statistical power at finding gene/exon boundaries. Student's t-statistic and log10 (probability) for raw (triangle) and quantile norm (cross) scores measure ability to distinguish boundary at base positions away from position 0 (gene or exon boundary ± 60 bp). The t-statistic is score difference from position 0. GC content (line) shows expected spikes at boundaries (x position 0): coding start and end, intron->exon, and exon->intron, with increased GC% in exon regions.

