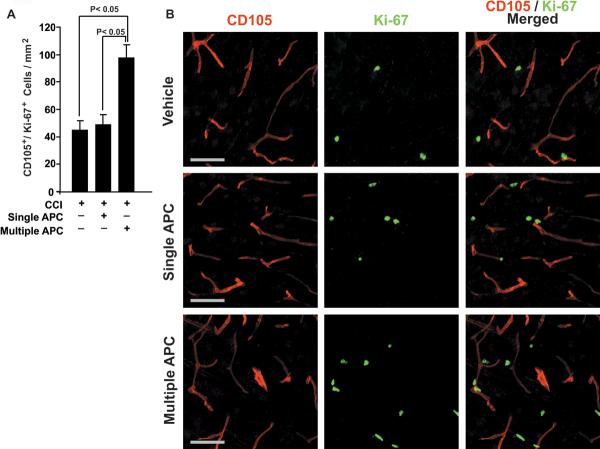
Figure 3. APC Mediates Formation of New Blood Vessels after CCI.
(A) CD105+/Ki-67+ cells are counted per mm2. Values are mean ± SEM (n=4–5 mice per group). (B) CD105 (left column) and Ki-67 (middle column) staining as well as their overlay (right column); Vehicle (top row), single-dose APC (middle row) and multi-dose APC (bottom row) are placed horizontally. Scale bar = 50 μm.

