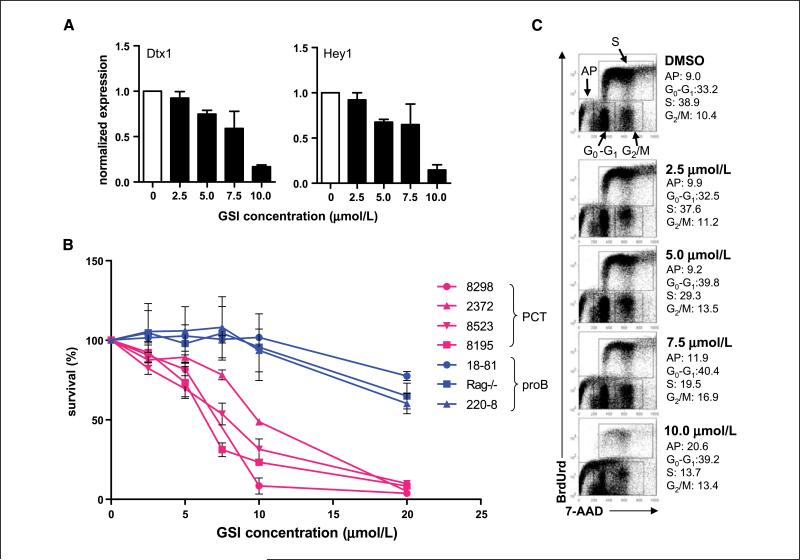
Figure 4.
Inhibition of NOTCH signaling in PCT cell lines by GSI treatment. PCT cell lines and pro-B-cell lines were treated with different concentration of GSI-XII for 36 h. A, the expressions of NOTCH targets Dtx1 and Hey1 were measured by qPCR in the GSI-treated ABPC8298 PCT cell line. Columns, mean compared with DMSO-treated cells for three independent experiments; bars, SE. B, proliferation of GSI-treated PCT and pro-B-cell lines was examined by the MTT assay. Points, mean compared with DMSO-treated cells for three independent experiments; bars, SE. C, representative flow cytometric analysis of BrdUrd incorporation and DNA content in GSI-treated PCT cell lines. GSI-treated cells were pulsed with 10 μmol/L BrdUrd for 30 min and then fixed, permeabilized, and stained for BrdUrd and 7-AAD. Compartments containing the apoptotic population (AP) and cells in the G0-G1, S, and G2-M phases of the cell cycle are identified at the top. The proportions of cells in each compartment for cells treated with DMSO alone and increasing concentrations of the GSI are given to the right of each profile.

