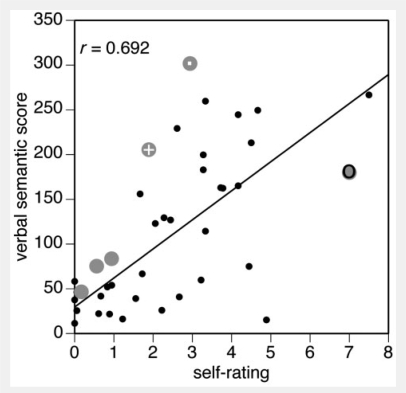
Figure 2.
The relation between self-ratings of expertise and verbal semantic scores. Data from healthy subjects are shown as small black dots, with the line representing the linear regression of the relationship, and data from prosopagnosic patients are shown as large grey discs. The data point for R-IOT3 (a retired car mechanic) is marked by a grey disc with a dark ring, and that for two other more-expert subjects, R-IOT4 and R-AT2, are marked by grey discs with a dot and a white cross, respectively.

