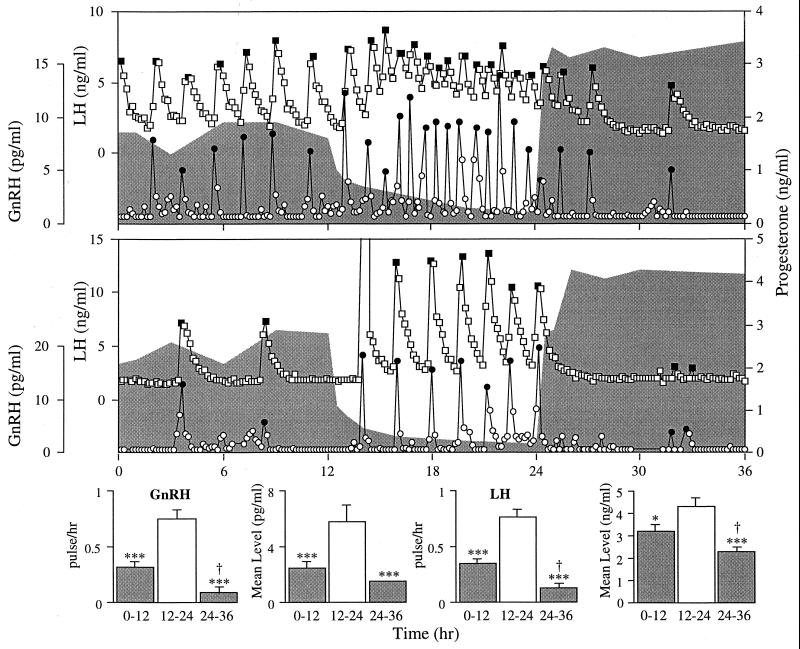
Figure 1.
(Upper) Circulating concentrations of portal GnRH and jugular LH and P for two representative ewes. Eight days before the start of this experiment, E was removed and two P implants were inserted. After removal of the implants (hour 12), P concentrations (shaded regions) fell steadily but rose rapidly after implants were replaced (hour 24). •, GnRH pulses; ■, LH pulses. (Lower) GnRH and LH pulse frequencies (mean ± SEM) and mean level over the three 12-hr periods for all 8 ewes. ∗, P < 0.05; ∗∗∗, P < 0.001 vs. 12- to 24-hr period; †, P < 0.05 vs. 0- to 12-hr period.

