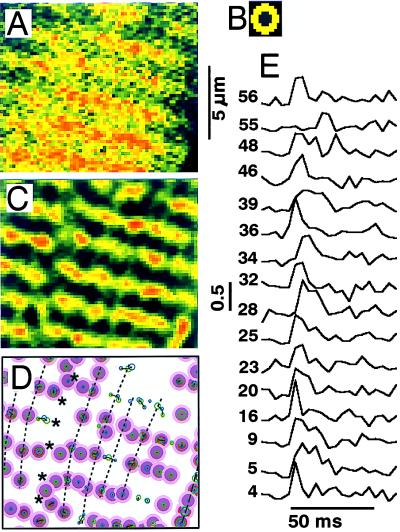
Figure 2.
Distribution and time course of focal Ca2+ release. Measured frames (A) were filtered with a center-minus-surround kernel (B) to enhance focal Ca2+ releases (C), determine their positions (D), and follow their time course (E). A shows the uncalibrated and unfiltered fluorescence intensities corresponding to the area indicated with a white box in the (3 × 3) filtered image in Fig. 1C. The contrast-enhanced image in C was derived entirely from the single frame in A and was scaled and offset to emphasize the local hot spots on the same color scale (Fig. 1 E Inset). Distinct release sites are shown in D (purple bull’s eyes) in relation to the surface of the cell (dashed line) and a fault in the sarcomere pattern (******). The smaller circles within the dark center of the bull’s eyes show the location and magnitude of releases during different voltage-clamp depolarizations (green and blue) and, when both are present, the center of gravity (red). Dotted lines indicate the longitudinal alignment of release sites. E shows the time course of ICa-induced focal Ca2+ releases at sites selected from a total of 149 distinct sites and identified by number. The tracings show the fluorescence intensity contrast-enhanced as in C and normalized relative to the resting fluorescence at each site.

