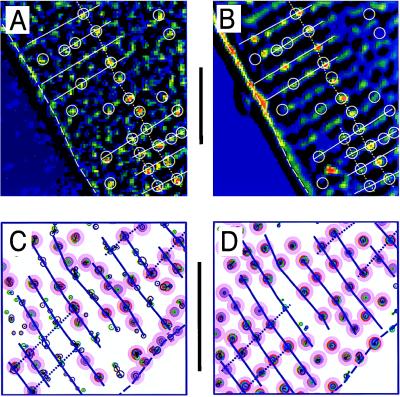
Figure 3.
Comparison of functional Ca2+ release sites measured with fluo-3 (A and C) to the membrane structures measured with di-2-ANEPEQ (B and D). A and B compare single contrast-enhanced frames. The computer-generated maps in the lower panes were derived from focal Ca2+ releases during five voltage-clamp depolarizations (C) and from three images recorded after staining the cell for 1, 2, and 3 min with 5 μM di-2 ANEPEQ (D). The overlays were drawn by hand from the Ca2+ images (A and C) and then transferred to the membrane images (B and D). Lines indicate cell surface (dashed), Z lines (solid), and longitudinal alignment (dotted). Circles indicate Ca2+ release sites. (Bars = 10 μm.)

