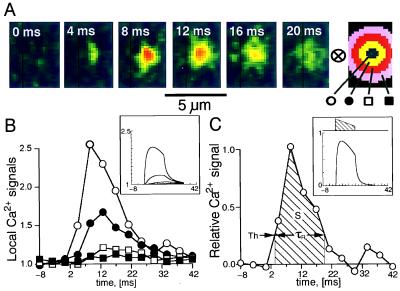
Figure 4.
Development and decay of a single, spontaneous focal Ca2+ release. A shows small sections of frames recorded at 4.167-ms intervals. The kernel at the far right was used to extract average fluorescence intensities at different distances from the center of the focal Ca2+ release. B shows these values normalized relative to the resting values and plotted versus time. C shows the difference between the center and the inner ring normalized relative to the resting fluorescence, i.e., it uses the same method of contrast enhancement as in Fig. 2. C also illustrates the approach of introducing a threshold (Th) to measure the duration, τR, and the integral, S, of release. B and C Insets show, with identical layout, results from a computer simulation. The hatched area in C Inset shows the time course of the release causing the simulated fluorescence distributions.

