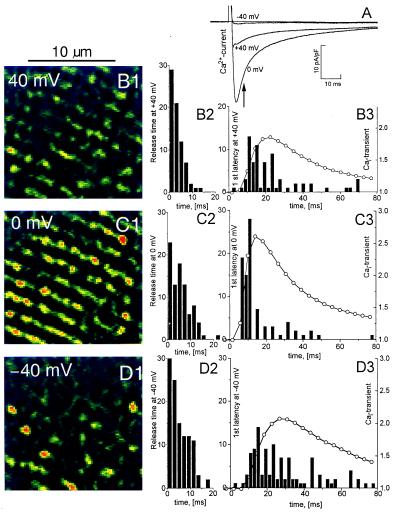
Figure 5.
Release time and first latency of release at different membrane potentials. Calcium currents (A) are compared with Cai-transients and focal Ca2+ releases measured at −40 mV (B1, B2, and B3), 0 mV (C1, C2, and C3), +40 mV (D1, D2, and D3) after depolarization from −70 mV. B1–D1 show parts of frames recorded at the time indicated with an arrow in A and filtered, as in Fig. 2C, to enhance local maxima. Histograms of release times are shown in B2– D2. B3–D3 show histograms of first latency superimposed on curves showing Cai-transients normalized relative to the resting fluorescence. Seventy-two distinct sites, 2 mM fluo-3, 5 mM EGTA.

