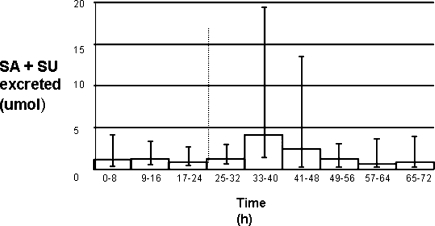
Figure 2.
Urinary SA + SU excreted throughout time course of 13C experiment: total SA + SU excreted during the 8 h urine collection periods. The columns represent the median value and the error bars the maximum and minimum values. The dotted line at 24 h shows the point at which the first dose of benzoic acid was introduced. One subject was omitted because of incomplete data.

