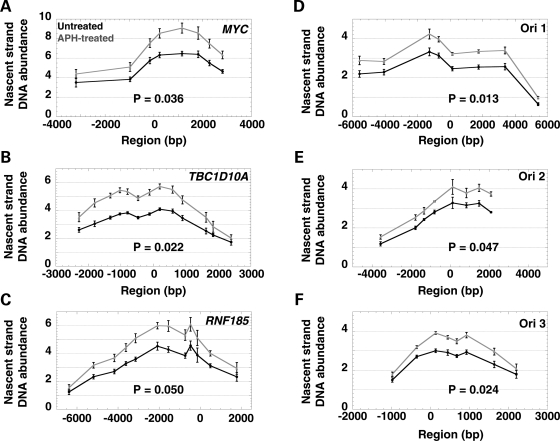
Figure 4.
Analysis of nascent strand DNA abundance at (A) the MYC origin, (B) the TBC1D10A origin, (C) the RNF185 origin and (D) the FRA3B ori 1, (E) ori 2 and (F) ori 3 in untreated cells (black) and APH-treated cells (gray). The X-axis illustrates the distance of each primer from the center of the origin (point zero). The location of the primers for FRA3B ori 1–3, a1–8, b1–8 and c1–8, respectively, MYC, TBC1D10A and RNF185 are shown in Fig. 2B and Supplementary Material, Fig. S2. The Y-axis indicates the nascent strand DNA abundance; note that the y-axis scale differs for control and FRA3B origins. The average and standard error of the nascent strand DNA abundance obtained for three independent experiments each quantified in triplicate are plotted across the five regions analyzed. The data were adjusted in two steps, first for the total number of cells, and then corrected for the number of cells in S phase and the length of S phase (see Material and Methods). The P-values associated with the comparisons between the nascent strand abundance levels observed in untreated and APH-treated cells for each region are indicated in each graph (see summary table of the statistical results in Fig. 5B).

