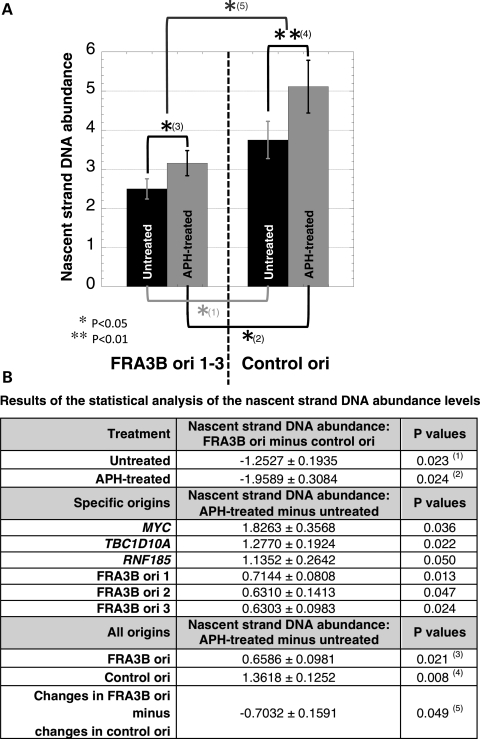
Figure 5.
Representation of the statistical analysis of nascent strand DNA abundance at the FRA3B ori 1–3 and the control origins. (A) Bar graph showing the average and standard error of all of the nascent strand DNA values obtained for three independent experiments, each quantified in triplicate across the FRA3B ori 1–3 regions and the control origins (MYC, TBC1D10A and RNF185) for untreated (black bars) and APH-treated cells (gray bars). (B) Table summarizing the results of the statistical analysis of the nascent strand DNA abundance levels for FRA3B ori 1–3 and control origins (MYC, TBC1D10A and RNF185) in untreated and APH-treated cells.

