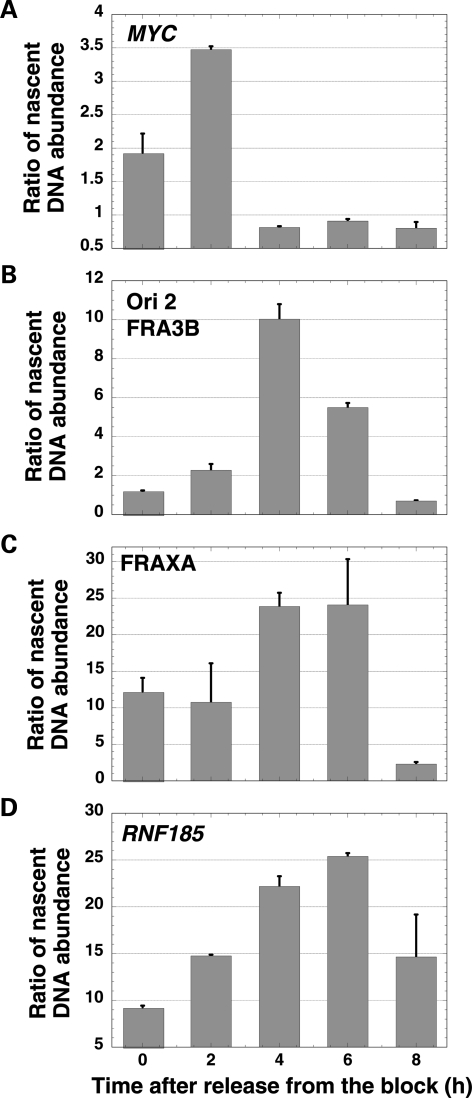
Figure 6.
Timing of origin firing using real-time PCR quantification of nascent DNA. (A) MYC. (B) FRA3B ori 2. (C) FRAXA. (D) RNF185. The X-axis shows the time in hours after release from the double-thymidine block, and the Y-axis represents the ratio of nascent DNA abundance in amplifications using the origin versus the non-origin primers. The timing of origin firing was performed independently twice and showed similar results, with FRA3B ori 2 replicating earlier than RNF185. A representative experiment is shown in the figure.

