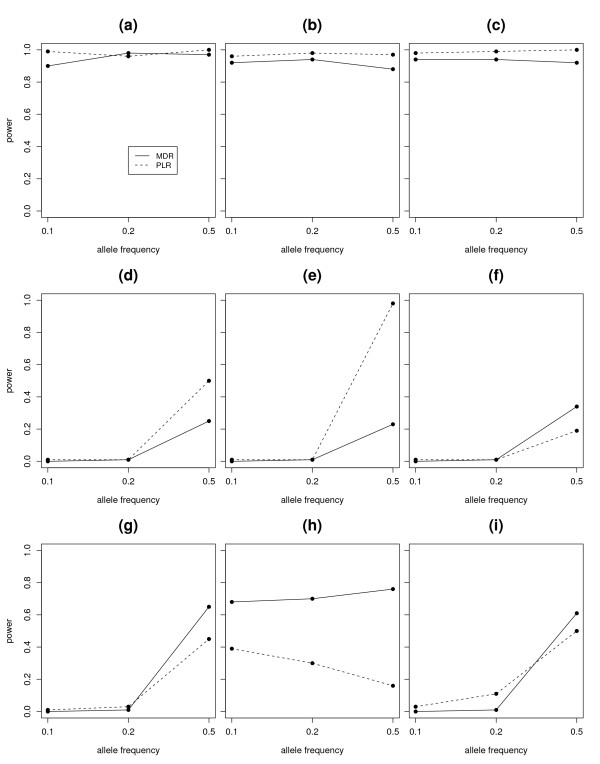
Figure 2.
Power Comparison for two-way interactions. Figure shows the power of MDR and PLR for detection of interaction under 9 different 2-way interaction models. Eeach plot represents the power of MDR and PLR under different allele frequencies of the associated SNPs. The power of MDR was presented with a solid line and the power of PLR was presented with a dashed line in each figure. The subfigures (a), (b), (c), (d), (e), (f), (g), (h), (i) represent the power plots for Model 1, Model 2, Model 3, Model 4, Model 5, Model 6, Model 7, Model 8 and Model 9 (Table 1) respectively.

