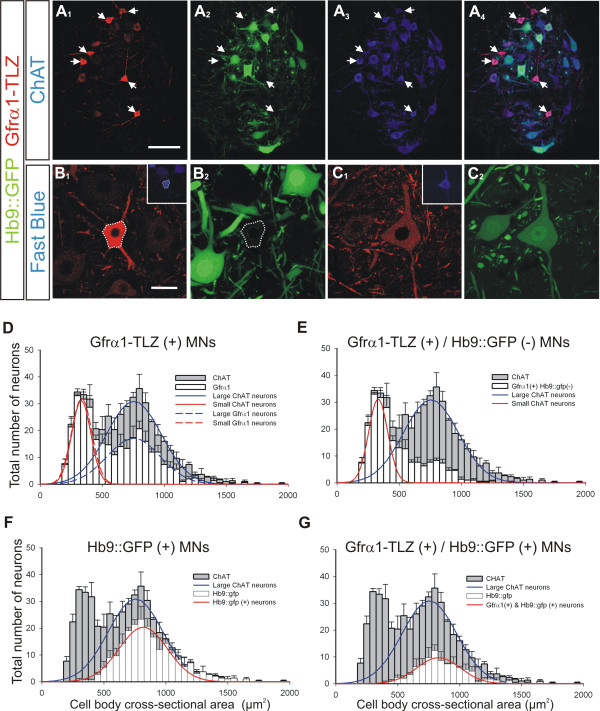
Figure 1.
Small size motor neurons in postnatal day 20 mouse spinal cords are strongly Gfrα1-TLZ positive and Hb9::GFP negative. (A) Confocal images of lumbar lamina IX showing Gfrα1-Tau-lacZ (TLZ) immunoreactivity (A1, red, cy3) and Hb9::GFP expression (A2, green) in ChAT+ MNs (A3, blue, Cy5); merged images in A4. Gfrα1-TLZ strongly positive MNs are small and Hb9::GFP negative (arrows in A1-4). (B) Small, strongly Gfrα1-TLZ positive MN (B1) retrogradely labeled from tibialis anterior muscle (Fast Blue, inset). This MN lacks Hb9::GFP (B2) (cell body location outlined). (C) Medium size MN with weak Gfrα1-TLZ immunoreactivity (C1) retrogradely labeled from tibialis anterior (inset) and expressing Hb9::GFP (C2). (D-G) Cell body size distributions of all ChAT+ MNs (gray bars; 50 μm2 bins, n = 3 animals; 481 ± 14.2 ChAT+ MNs analyzed per animal in six 70-μm thick ventral horn sections; error bars represent SEMs) with superimposed (white bars) distributions for the following subpopulations: all Gfrα1-TLZ+ MNs (D), Gfrα1-TLZ+ and Hb9::GFP- MNs (E), all Hb9::GFP+ MNs (F), MNs co-expressing Gfrα1-TLZ and Hb9::GFP (G). ChAT+ MNs were fit by two Gaussian curves of different widths representing small (D and E, red solid line) and large populations (D to G, blue solid lines). Two similar curves (dashed lines) fit Gfrα1-TLZ+ MNs. Most 'small' ChAT+ MNs are Gfrα1-TLZ+. Irrespective of Gfrα1-TLZ, Hb9::GFP+ neurons (solid red lines in F and G) display unimodal size distributions of averages and standard deviations resembling large ChAT+ MNs. Scale bars: (A) 100 μm; (B) 40 μm (also applies to (C)).

