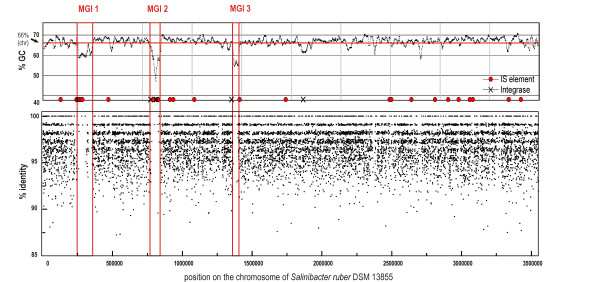
Figure 1.
Salinibacter ruber DSM 13855 genome and metagenomic islands. (a) GC-content of Salinibacter ruber genome plotted with a sliding window of 1000 nucleotides. Location of integrases and IS transposases along the genome are indicated. (b) Coverage of San Diego saltern crystallizer metagenomic reads. Individual metagenomic reads were aligned to the sequenced strain genome and the alignment-sequence conservation visualized in the form of percent identity plot. Each dot on the graph represents an individual sequence read aligned along its homologous region in Salinibacter ruber DSM 13855 genome. Y axis reflects its nucleotide percent identity to syntenic region. The regions lacking representation in the metagenome are boxed and described in the text as metagenomic islands.

