
Figure 3.
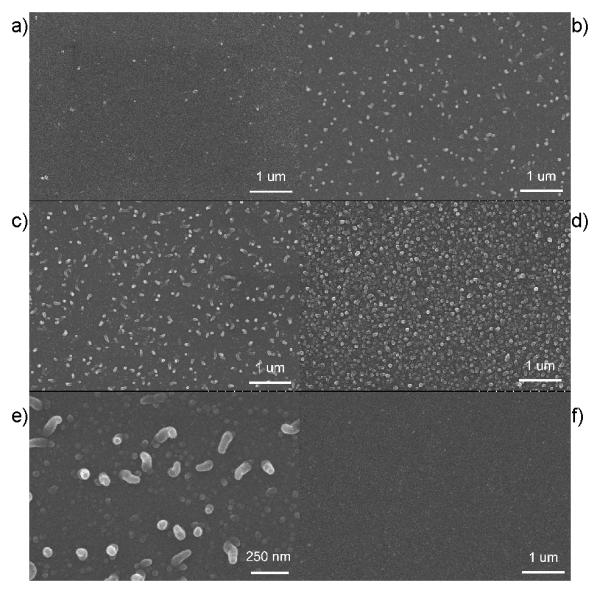
SEM images of DDPpy surface and Ppy-only surface. (a-d): DDPpy after being polymerized for 50s, 150s, 300s, 500s with 20 k magnification. (e): DDPpy after being polymerized for 300s with 70k magnification. (f): Ppy after being polymerized for 500s with 20k magnification. Scale bars are illustrated for each image.