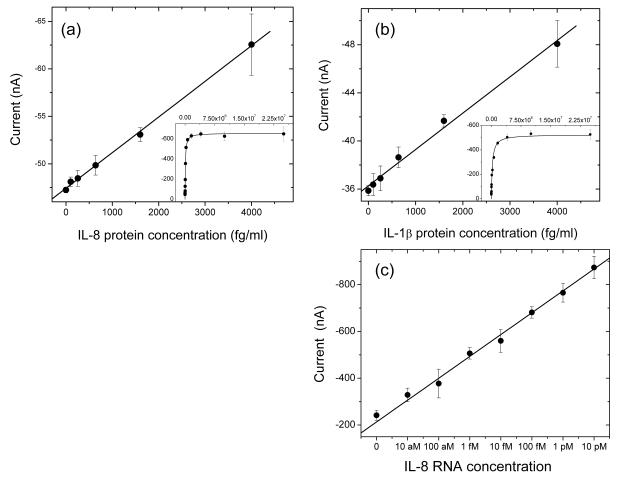
Figure 5.
Concentration profile by plotting amperometric current intensities with correspondent (a) IL-8 protein (R2=0.99 for low concentration), (b) IL-1β protein (R2=0.99 for low concentration) and (c) IL-8 RNA (R2=0.98) concentration with the linear fitting results. The sensor response from 0 to 25 ng of IL-8 and IL-1β protein are listed in the inlets fitted with Langmuir isotherm.

