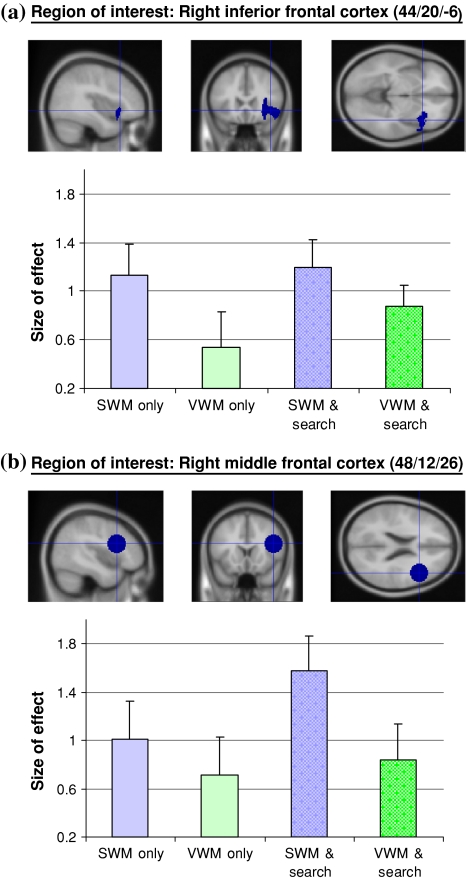
Fig. 6.
Region of interest analyses in R MFG and R IFG. Sagittal, coronal and axial views of the right IFG ROI (a) and right MFG ROI (b). These regions were defined apriori using the results of our previous fMRI study on inefficient search (Anderson et al. 2007). The right IFG region was defined by a cluster of activity centered around the MNI coordinates [44/20/-6] (see “Methods”). The right MFG region was defined by a sphere with a 15 mm radius centered on the MNI coordinates [48/12/26]. The bar graphs represent parameter estimates for spatial (blue) and verbal (green) working memory, for single and dual-task conditions, within these two regions. Error bars indicate the SE of the mean for the group

