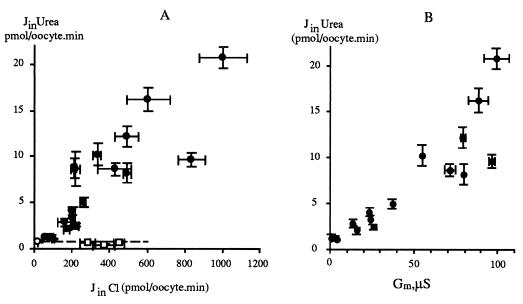
Figure 4.
Correlation between urea flux, chloride flux and anion conductance. (A) Urea flux vs. chloride flux for oocytes expressing tAE1 (closed circles) and mAE1 (open squares). (mean ± SE; n = 8 for JinCl and JinUrea. (B) Urea flux vs. anion conductance, Gm, for oocytes expressing tAE1. Anion conductance was measured by the two electrode voltage clamp technique (see Experimental Procedures). (n = 8.)

