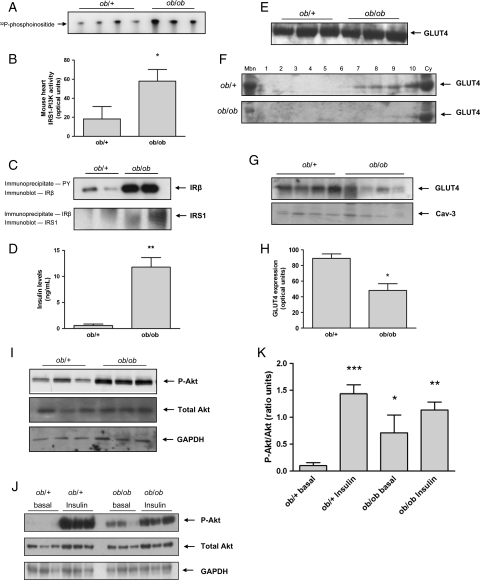
Figure 6.
Myocardial IRS1-PI3K, Akt, and sarcolemmal GLUT4 in ob/ob mice. (A) Autoradiograph of in vitro kinase assay of IRS1-PI3K activity in the mouse heart. (B) Quantification of IRS1-PI3K activity in arbitrary optical units; (*P < 0.01). (C) Immunoblot of the insulin receptor beta (IR-β) subunit following phosphotyrosine immunoprecipitation (upper panel) and immunoblot of insulin receptor substrate-1 following IR-β immunoprecipitation (lower panel). (D) Fasting serum insulin levels of ob/+ and ob/ob mice (**P = 0.001). (E) Immunoblot of GLUT4 levels in total heart lysates from ob/+ and ob/ob mice. (F) Immunoblots of GLUT4 in the sarcolemmal fraction (Mbn), across subcellular fractions (1–10) and in the cytosol (cy) in ob/+ controls (upper panel) and ob/ob (lower panel) mice. (G) Immunoblot of GLUT4 levels at the sarcolemma and Caveolin-3 (Cav-3) loading control. (H) Quantification of GLUT4 levels at the sarcolemma in arbitrary optical units; ob/+ (n = 4), ob/ob (n = 4), *P < 0.01. (I) Representative immunoblots of myocardial phospho-Akt (top panel), total Akt (middle panel), and GAPDH (lower panel) expression in ob/+ and ob/ob mice. (J) Representative immunoblots of myocardial phospho-Akt (top panel), total Akt (middle panel), and GAPDH (lower panel) expression in ob/+ and ob/ob mice at basal state and after 30 min of insulin stimulation. (K) Quantification of phospho-Akt to total Akt ratio in ob/+ and ob/ob with and without insulin stimulation in ratio units. *P < 0.01 vs. ob/+ basal, **P < 0.001 vs. ob/+ basal, and ***P < 0.0001 vs. ob/+ basal.

