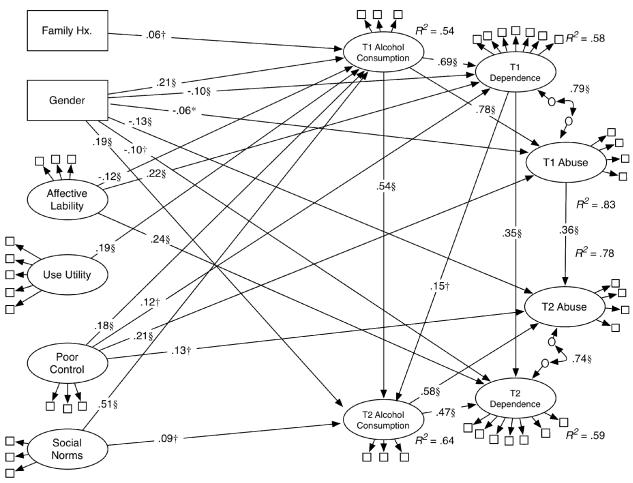
Figure 2.
Structural model for the full alcohol use sample (N = 2084). All values are standardized coefficients. Gender is coded 1 = Men, 0 = Women. *p < .05, †p < .01, §p < .001. Error variances between paired T1 and T2 indicators were allowed to covary. Nonsignificant paths from family history, lability, poor control, and use utility to T2 consumption, poor control to T2 dependence, lability to T1 abuse are omitted for clarity but are included in model estimation.

