
Figure 3.
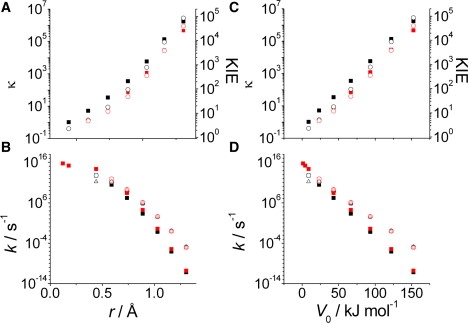
Effect of the barrier width r (A and B) and V0 (C and D) on proton transfer within malonaldehyde. κ (for H; solid squares) and the KIE (open circles) are shown in panels A and C and kTST (solid squares), ktun (open triangles), and kobs (open circles) shown in panels B and D. Note that the ktun and kobs values are essentially superimposed. Black data were calculated for free energy barriers and the red data for barriers were calculated using Eq. 2.