
Figure 5.
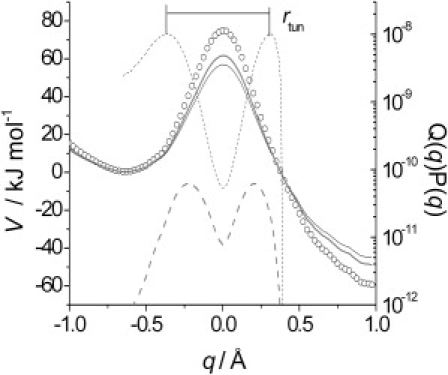
Representative barrier for proton transfer in AADH. The barrier (open circles) was approximately corrected for ZPE contributions (Eq. 2) and the corrected barriers for H and D transfer are shown (solid black and shaded lines, respectively). Overlayed is the transfer probability P(q)Q(q) for H and D (dashed solid and shaded lines, respectively). Representative tunneling distance, rtun, is labeled for H-transfer.