
Figure 6.
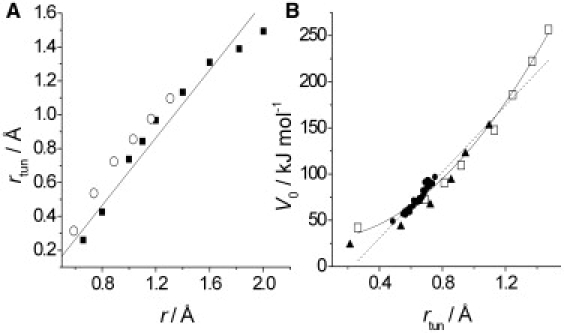
Correlation between rtun and r for H (as opposed to D) transfer in CH4/CH3− (solid squares) and malonaldehyde (open circles) (A); solid line shows a slope of 1:1. (B) Relationship among V0 and rtun (for H transfer) in CH4/CH3− (open squares), malonaldehyde (solid triangles), and AADH (solid circles). Combined data are fit to linear (dotted line) and quadratic (V0 ∝ r2tun; solid line) functions.