
Figure 7.
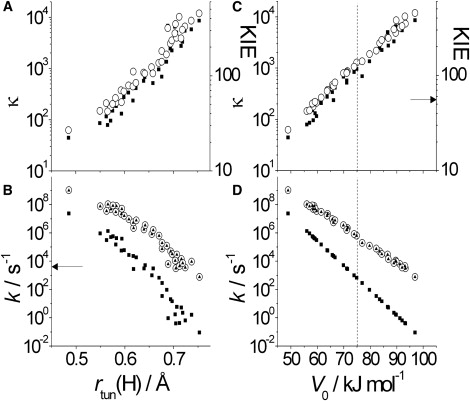
Dependence on rtun (for H-transfer) (A and B) and V0 (C and D) of proton transfer in AADH. κ (for H; solid squares) and the KIE (open circles) are shown in panels A and C; and kTST (solid squares), ktun (open circles), and kobs (solid triangles) are shown in panels B and D. Note that the ktun and kobs values are essentially superimposed and the dotted horizontal lines in panels C and D mark the average barrier potential (see Fig. S8). Arrows mark the experimentally observed kobs and KIE values (38). See text for more details.