
Figure 2.
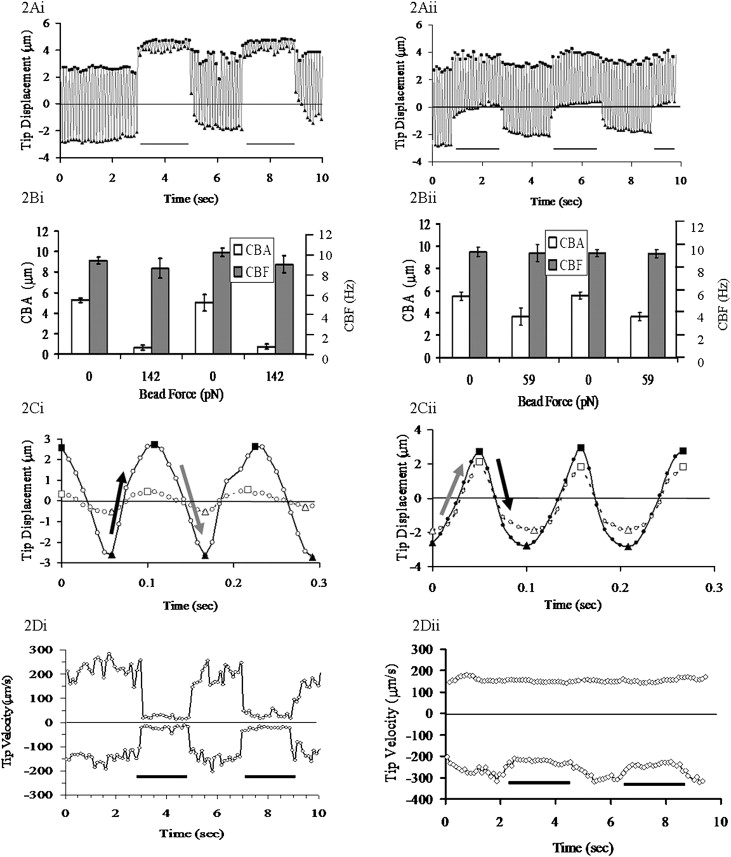
Cilia beat pattern in the pulse experiments: (i) effective stroke in the direction of the bead (magnetic) force, and (ii) recovery stroke in the direction of the bead force. (A) Position versus time trace of 2.8 μm beads attached to a human bronchial epithelial cilium. The line at the base of the graph indicates force on/off. (B) CBA and CBF with and without the applied bead force. (C) Closer inspection of the cilia beat pattern with the force on (solid line) and off (dashed line) from panel A. The line is the bead's motion, the squares are the local maximums, and the triangles are the local minimums. The gray arrows indicate the effective stroke of the cilia, and the black arrows the recovery stroke. (D) Instantaneous maximum velocity of beating cilia for the tip position data in panel A. In all charts, the position/velocity scale is oriented to be in the direction of the external force.