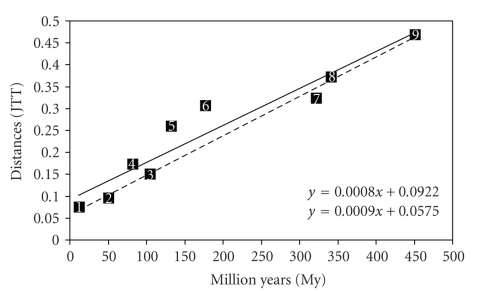
Figure 1.
Regression line of divergence times derived from the fossil record (Table 1) and the correspondent distances (JTT method) in different vertebrate pairs. For the continuous line: 1. M. musculus – R. norvergicus, 2. X. laevis – X. tropicalis, 3. H. sapiens – B. taurus, 4. H. sapiens – M. musculus, 5. H. sapiens – M. domestica, 6. H. sapiens – O. anatinus, 7. H. sapiens – G. gallus, 8. H. sapiens – X. laevis, 9. H. sapiens – T. rubripes. For the dashed line: same pairs, comparisons involving nonplacental mammals (points 5 and 6) were excluded.

