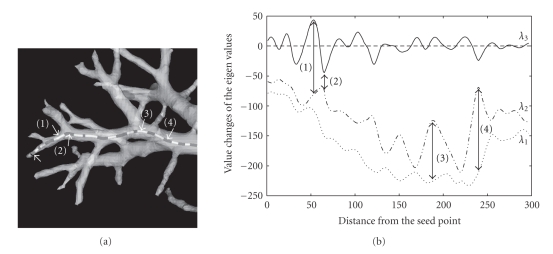
Figure 2.
A trajectory of vessel segments and value changes of the eigenvalues along the trajectory. Left-most white arrow in (a) shows the starting point of the trajectory that advances left to right. The trajectory is calculated with fixed σ f = 1. λ 3 oscillates as the front advances and takes negative values close to the junctions indicated by dark gray regions on the trajectory. λ 3 takes large values at location (1) and (2) making absolute value of the ratio λ 3/λ 2 larger. At locations (3) and (4), the ratio λ 2/λ 1 becomes small.

