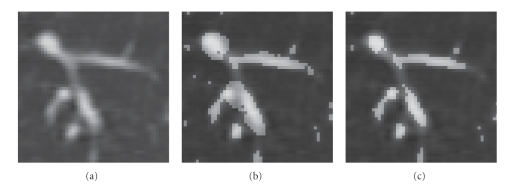
Figure 3.
Segmentation results by thresholding the filter output with a fixed value (−600 [H.U.]). (a) Original CT image visualized using a window of 1500 H.U. at the level of −400 H.U. (b) A fixed is used for all voxels. (c) (2) is used to determine S. In (b), nonvessel regions around a junction are also extracted as vessels whereas segmented regions reside within the visible vessels in (c). It should be noted that while vessel segments do not appear to be connected in this image, they are connected in the neighboring slices. In the event that they were not connected, the local disconnections would be fixed by the tracking process described in Section 2.2.

