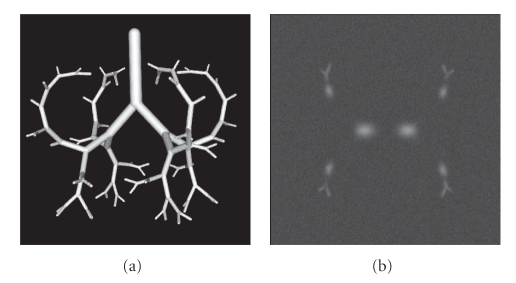
Figure 5.
Visualization of the phantom data. (a) Surface display of the simulated vascular tree. (b) Cross-section of a phantom subjected to Gaussian noise of standard deviation σ = 30. The model contains 62 branchpoints and 125 segments. Intensity values at the center of the segments vary depending on the radius of the segment to mimic vessels in typical thoracic CT images. Gaussian noise with different standard deviations was added.

