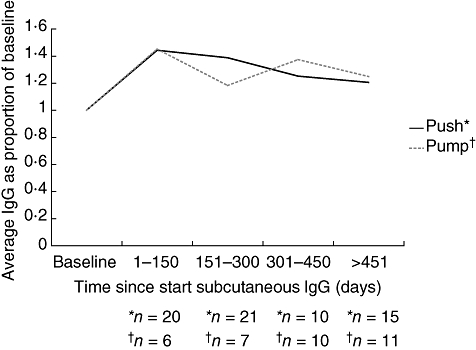
Fig. 1.

Mean serum immunoglobulin (Ig)G levels over time in patients self-administering subcutaneous immunoglobulin (SCIg) by a pump or the rapid push method. The graph represents data from those patients who switched from IVIg to SCIg. Levels as expressed as proportions of the baseline (i.e. start of study) through IgG levels while on IVIg.
