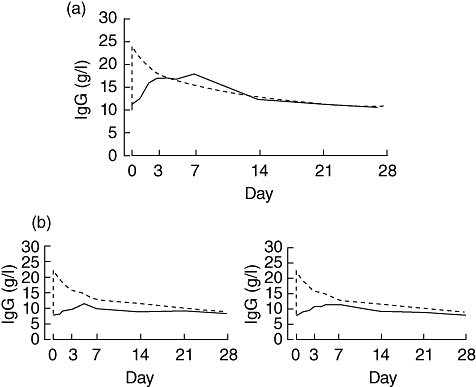
Fig. 2.

Serum immunoglobulin (Ig)G concentrations over time following intravenous (i.v.) (---) or subcutaneous (s.c.) (—) infusion of 10%Ig facilitated by rHuPH20. (a) Serum IgG concentrations in one patient following s.c. infusion using rHuPH20 at a concentration of 50 U/g 10%Ig. (b) Serum IgG concentrations in a second patient following s.c. infusion using rHuPH20 at a concentration of either 50 U/g 10%Ig (left panel) or 200 U/g 10%Ig (right panel). Area under the curve (AUC) was 75·83% and 77·83% of the AUC following i.v. infusion of the same IgG quantity, respectively.
