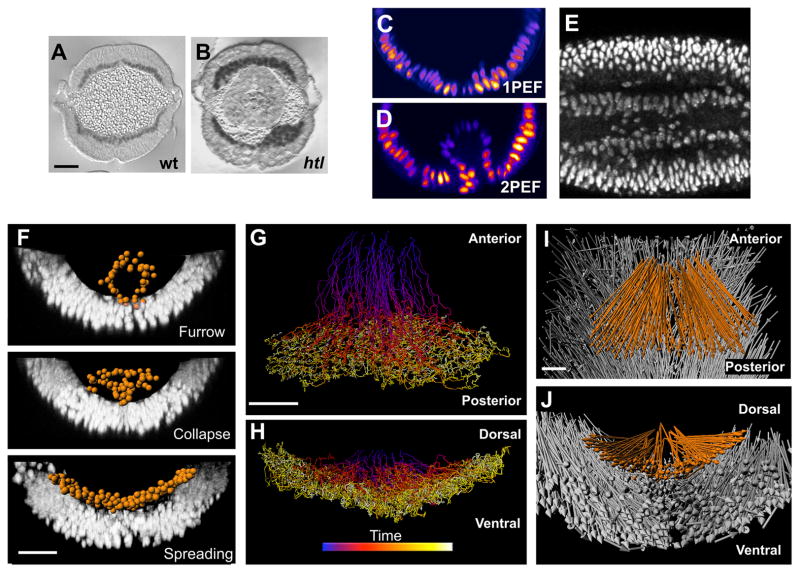
Fig. 1.
Two-photon microscopy and analysis of histone2A (H2A)–GFP expressing embryos captures key events in gastrulation. (A and B) Cross-sections of wild-type (A) and htl mutant (B) embryos stained with antibody to Twist. (C and D) Confocal 1PEF (C) fails to image internalized mesoderm cells, whereas 2PEF (D) captures the positions of the internalized cells. (E) A 50-μm-deep and 10-μm-thick lateral slice through an H2A-GFP embryo demonstrates the signal-to-noise ratio (anterior, left). (F) Segmentation of mesoderm nuclei (orange spheres) by the use of Imaris software (Bitplane AG, Zurich, Switzerland). Each sphere was defined by the fluorescent intensity of H2A-GFP. Furrow formation, furrow collapse as a result of an EMT, and spreading of the mesoderm to form a monolayer are illustrated from top to bottom, respectively. (G to J) Tracking cell positions in three dimensions over time. Shown are dorsal (G) and posterior (H) views of mesoderm tracks (blue and yellow indicate early and late time points, respectively) and dorsal (I) and posterior (J) views of mesoderm (orange) and ectoderm (gray) net displacement vectors. Scale bars, 20 μm.

