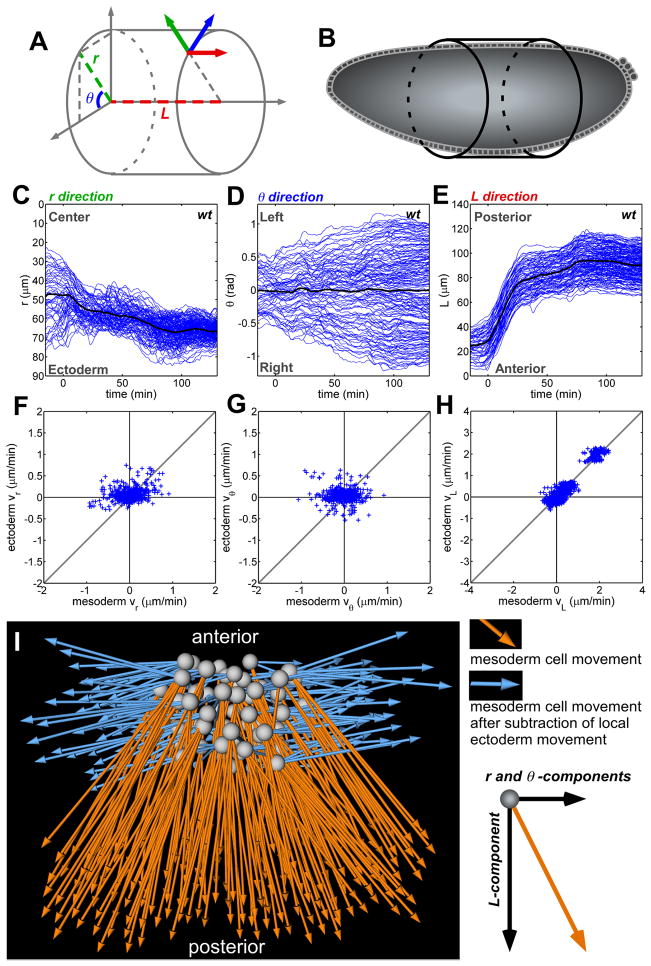
Fig. 2.
Decomposition and correlative analysis of cell movements with the use of cylindrical coordinates. (A and B) The use of cylindrical coordinates allows the positioning of cells according to the body plan of the embryo at stage 6. (C to E) Cell trajectories (blue lines) reveal that each axis corresponds to a morphogenetic movement. (C) r is the radial position over time (for example, furrow collapse and intercalation; 0 indicates the center of the embryo). (D) θ is the angular movement (for example, mesoderm spreading and ectoderm convergence; 0 indicates the position of the ventral midline). (E) L corresponds to the movement of cells along the length of the embryo (for example, germ-band elongation). In (C) to (E), time (t) = 0 is set as the point when AP movement begins. (F to H) Correlation of the velocity (v) of each mesoderm cell with its six nearest ectodermal neighbors along the (F) radial, (G) angular, and (H) AP axes, with correlation values of 0.21 ± 0.43, 0.08 ± 0.18, and 0.90 ± 0.06, respectively (n = 3 embryos). (I) Dorsal view of mesoderm cell displacement before (orange) and after (blue) subtraction of local ectoderm cell movements.

