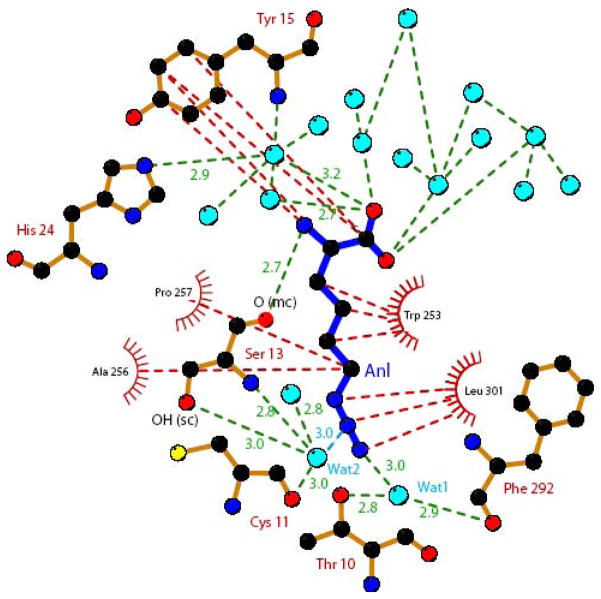
Figure 4.
Schematic representation of hydrophobic (red dotted lines) and electrostatic (green dotted lines) interactions made between MetRS-SLL and azidonorleucine. Anl is represented with blue bonds. Carbons are in black, nitrogens in dark blue, oxygens in red and sulfurs in yellow. Water molecules are symbolized as light blue spheres. Relevant hydrogen bonding distances are indicated in Å. The electrostatic interaction between Wat2 and the N2 atom of Anl is indicated by a blue dotted line. The figure was drawn with Ligplot 38.

