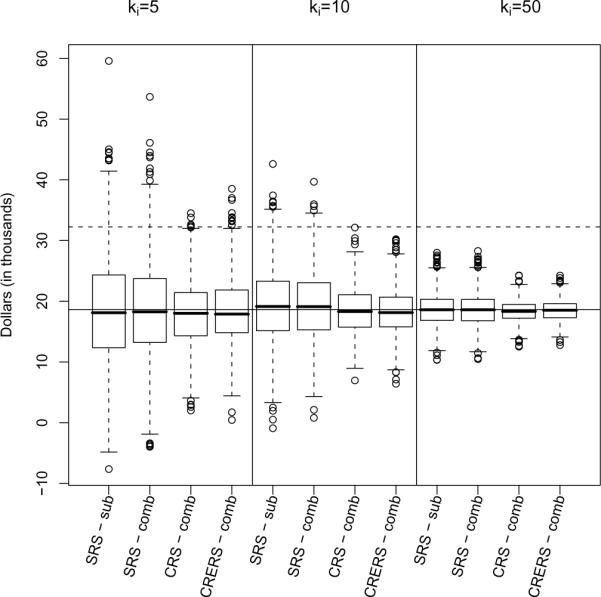
Fig. 6.

Subsampling distributions for in the simplified within group confounding model for four estimation approaches: subsample data based on simple random subsamples (SRS-sub), combined data based on simple random subsamples (SRS-comb), combined data based on college random subsamples (CRS-comb), combined data based on college random subsamples with ecological racial proportions (CRERS-comb). The solid horizontal line represents the full data MLE, and the dashed line represents the ecological estimate.
