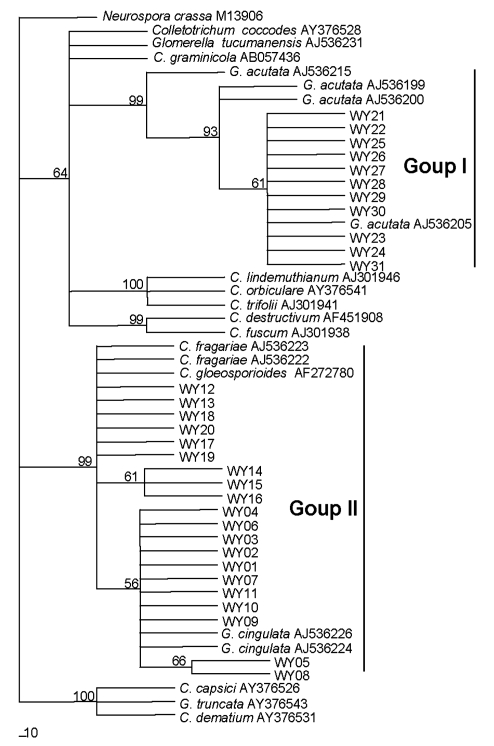
Fig. 2.
Phylogram generated from parsimony analysis based on complete sequence of ITS1-5.8S-ITS2 ribosomal RNA genes of 52 sequences with Neurospora crassa as outgroup
Data were analyzed with random addition sequence, unweighted parsimony and treating gaps as missing data. Bootstrap values ≥50% are shown above or below branches. The numbers near each branch represent percentages out of 100 bootstrap replications

