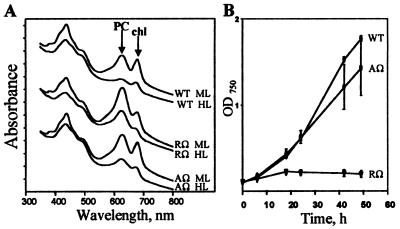
Figure 5.
(A) Whole-cell absorbance spectra of wild type (WT), nblRΩ (RΩ), and nblAΩ (AΩ) grown at medium light (ML) or high light (HL) (70 and 500 μmol photons m−2⋅s−1, respectively). Cultures were adjusted to the same OD750 before determining the spectra. The spectra were offset along the y axis. Arrows indicate the absorbance peaks of PC and chl. (B) Growth, as measured by OD750, of WT, nblRΩ, and nblAΩ at HL (500 μmol photons m−2⋅s−1).

