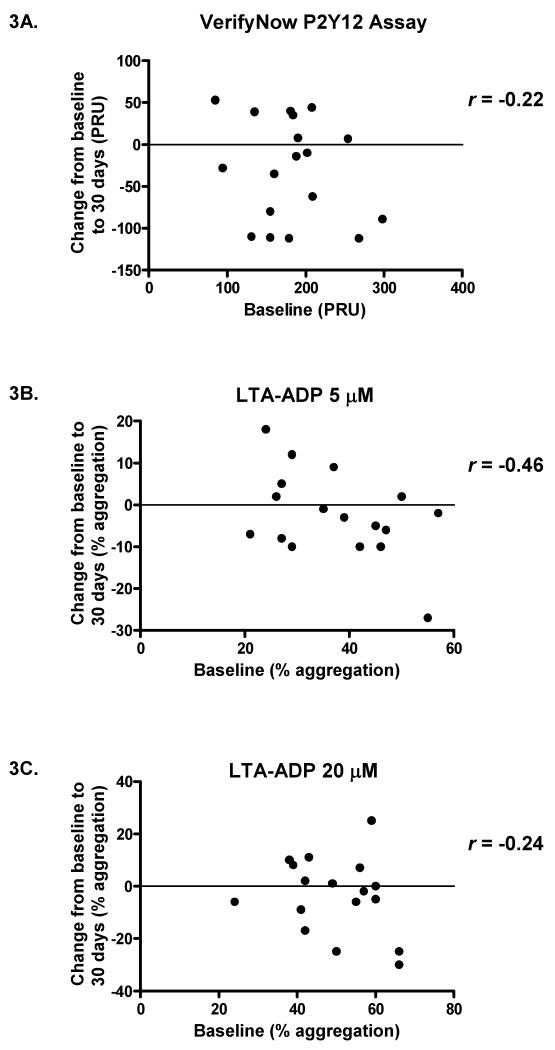
Figure 3. Baseline platelet function at 75 mg clopidogrel did not predict response to the increased dose of clopidogrel.
The baseline results for subjects taking 75 mg clopidogrel were plotted against the changes in response after switching to 150 mg clopidogrel (values at 30-day time point minus values at baseline). Pearson correlations (r) were calculated for the VerifyNow P2Y12 assay (Figure 4A), light transmittance aggregometry stimulated by 5 μM ADP (Figure 4B), and light transmittance aggregometry with 20 μM ADP (Figure 4C). For all three assays, there were no significant correlations between baseline values and changes in platelet response (p = 0.37, 0.063, and 0.35, respectively, for Figures 4A, 4B, and 4C). PRU = P2Y12 reaction units, LTA = light transmittance aggregometry, and ADP = adenosine diphosphate.

