
Figure 4.
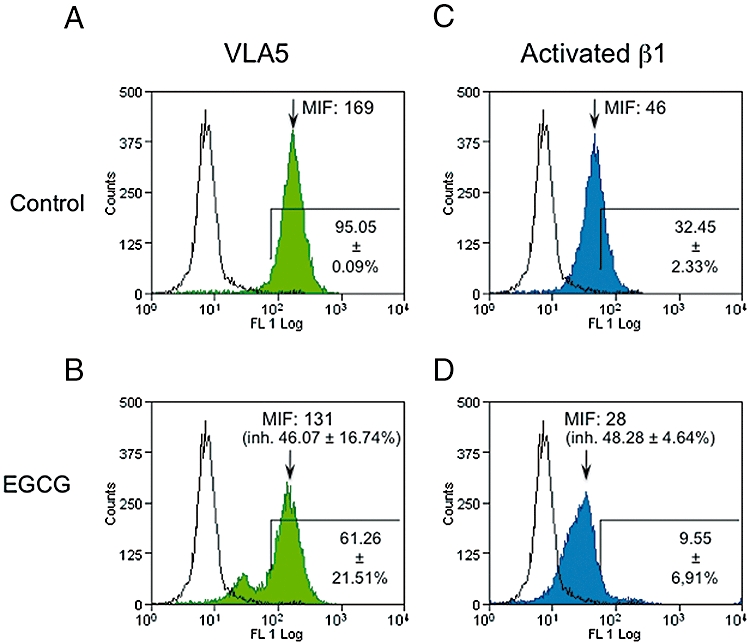
Surface expression of VLA5 and CD29 on human monocyte cell line cells treated with 100 µM epigallocatechin gallate (EGCG) for 8 h or left untreated. The experimental record from one representative experiment is shown. Cells were incubated with anti-human VLA5 (α5/β1 integrin, green histograms) or anti-human CD29 (activated β1 integrin, blue histograms) monoclonal antibodies, followed by incubation with Alexa Fluor 488 goat anti-mouse IgG. Cells incubated with secondary antibody alone are shown as empty histograms in each panel. The percentage of marked cells (mean ± SEM of four different experiments, shown on lower right of each panel) was calculated for (A) control cells stained with anti-VLA5, (B) treated cells stained with anti-VLA5, (C) control cells stained with anti-CD29 and (D) treated cells stained with anti-CD29. In (B) and (D), the percentage (±SEM) reductions of median intensity of fluorescence (MIF) from four independent experiments are shown in parentheses.