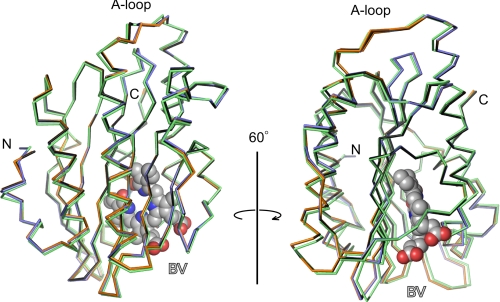
FIGURE 2.
Structural comparison of PcyA-BV, PcyA-18EtBV, PcyA-BV13, and E76Q-BV complexes. The Cα traces of PcyA-BV (black), PcyA-18EtBV (blue), PcyA-BV13 (orange), and E76Q-BV (green) are superimposed to minimize the root mean square deviation of the corresponding Cαs with CCP4mg (47, 48). For clarity, only BV in PcyA-BV is shown by the Corey, Pauling, Koltun model. The figure was prepared with PyMOL (49).

