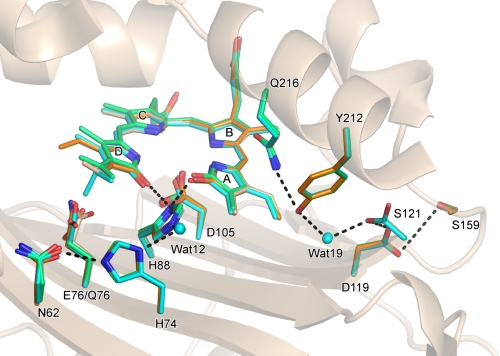
FIGURE 7.
Hydrogen bond network from the molecular surface to the processing site in the A-ring. The structures of the PcyA-BV (white), PcyA-18EtBV (blue), PcyA-BV13 (orange), and E76Q-BV (green) complexes are superimposed. Bilins, Asn-62, His-74, Glu-76, Gln-76, His-88, Asp-105, Asp-119, Ser-121, Ser-159, Tyr-212, and Gln-216 are shown by stick models. The side chain of Ser-121 in PcyA-18EtBV adopted two conformations. Hydrogen bonds are drawn with heavy dotted lines. For clarity, the hydrogen bonds in which Asp-105 is involved are not shown. The network from Asn-62 to His-88 is conserved in all complexes, but the interactions between Glu-76 Oϵ/Gln-76 Nϵ and Asn-62 Oδ vary; hydrogen bond is present in PcyA-18EtBV (2.33Å) and PcyA-BV13 (2.66 Å) (dotted line is not given), whereas it is absent in PcyA-BV and PcyA-E76Q.

