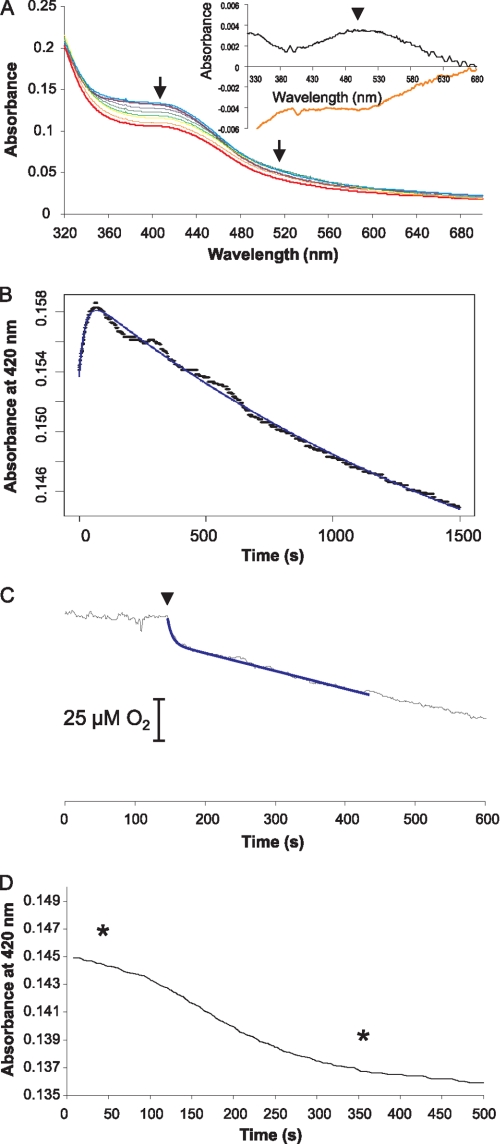
FIGURE 5.
Spectral changes and oxygen consumption with an NmFNR-DNA complex. A, spectrum of the anoxic NmFNR-DNA complex is shown in bold in violet. Spectral scans taken periodically over 2,040 s following the introduction of 200 μm oxygen are displayed in purple, blue, green, yellow, orange, and red, respectively, with increasing time. Arrows indicate the trend of absorbance change over the period (i.e. absorbance decreases at 400 nm and between 500 and 600 nm). The inset shows the difference spectrum calculated from the spectrum at time = 1 min minus time 0 (black line) and the difference spectrum following a return to anaerobiosis of an oxygen-treated NmFNR-DNA complex (orange line, spectra from time points indicated in D, below). B, absorbance change at 420 nm monitored over time. The spectral changes fit to two linked exponentials with rate constants of 0.043 s−1 and 0.00051 s−1. C, disappearance of oxygen caused by FNR was monitored using a Clark electrode. 20 μm NmFNR-DNA was introduced as marked by an arrowhead. D, NmFNR-DNA complex was exposed to oxygen for 30 min, after which time oxygen depletion was completed. A drop in absorbance at 420 nm was observed following this return to anoxia. Spectra were measured using an equivalent experiment at the times marked by asterisks. The difference between these spectra is shown in the inset to A. Arrowhead indicates the maximum absorbance differences.

