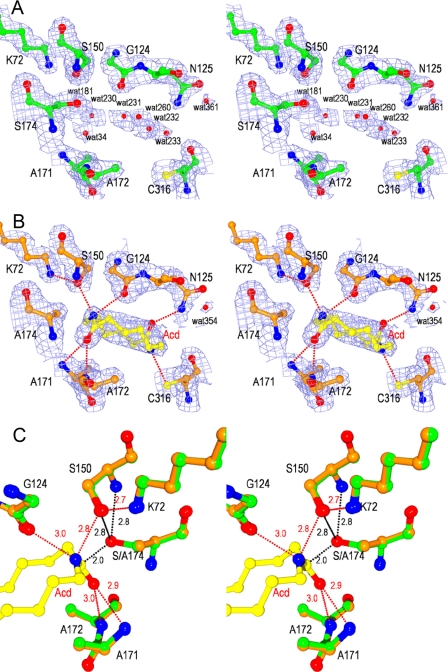
FIGURE 3.
Stereoviews of catalytic cleft of NylA and NylA-A174·Acd complex. A and B, 2Fo − Fc electron density maps of NylA (green) (A) and the NylA-A174·Acd complex (orange) (B) contoured at 1.0 σ. Side chain atoms of catalytic/binding residues (Lys72, Gly124, Asn125, cis-Ser150, Ala171, Ala172, Ser174 (Ala174), and Cys316), water molecules, and substrate Acd are shown. C, structure around catalytic residues of NylA (green) was superimposed with that around corresponding residues of the NylA-A174·Acd complex (orange). Carbon, nitrogen, and oxygen atoms in substrate Acd are shown in yellow, blue, and red, respectively. Possible hydrogen bonds are indicated as red dotted lines with the distances in angstroms.

