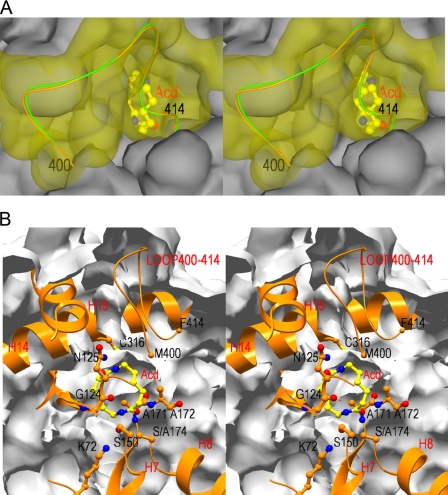
FIGURE 4.
Surface structures of the entrance of the catalytic cleft of NylA-A174·Acd complex. A, stereoview of the entrance of the catalytic cleft. The flexible loop region (positions 400–414) is shown in yellow, whereas rest of the region is shown in gray. B, stereoview of cross-section, including catalytic/binding residues and substrate Acd. The main chain folding (ribbon diagram) and side chain (ball and stick diagram) of catalytic/binding residues (Lys72, Gly124, Asn125, cis-Ser150, Ala171, Ala172, Ser174 (Ala174), and Cys316) are shown. The surface is shown as a gray layer. Carbon, nitrogen, and oxygen atoms in substrate Acd are shown in yellow, blue, and red, respectively.

