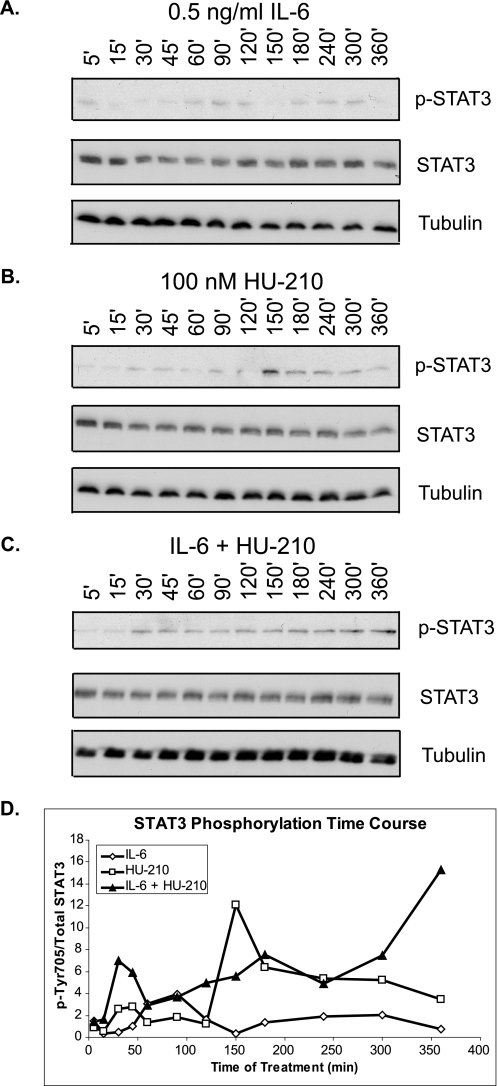
FIGURE 6.
Activation of CB1R and IL-6R results in sustained STAT3 phosphorylation. N2A cells were serum-starved for 24 h and treated with 0.5 ng/ml IL-6 (A), 100 nm HU-210 (B), or both (C) for the indicated periods of time. The cells were lysed and subjected to immunoblot analysis for phospho-STAT3 (p-STAT; phospho-Tyr705), total STAT3, and tubulin. The blots shown are representative of three independent experiments. D, quantification of STAT3 phosphorylation represented as phospho-Tyr705/STAT3 ratio over time.

