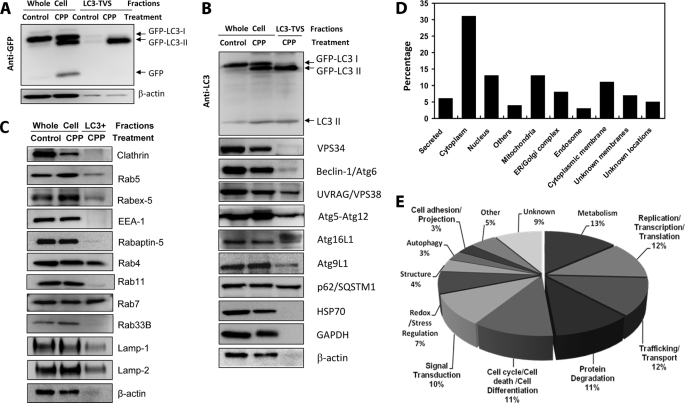
FIGURE 4.
Protein expression profile of LC3-TVS. A–C, total lysates from HEK-293-GFP-LC3 cells treated with control medium or CPP for 6 h (whole cells) or from isolated LC3-TVS were subjected to immunoblot assay with indicated antibodies. Equal amounts of proteins were loaded per lane. GFP-LC3 was detected using an anti-GFP antibody (A) or an anti-LC3 antibody (B). Endogenous LC3 was identified with the same anti-LC3 antibody (B). All other autophagy-related molecules (B) and endosomal related molecules (C) were detected using the corresponding antibodies except that the Atg5-Atg12 complex was identified using an anti-Atg5 antibody. D and E, total lysates of LC3-TVS were subjected to proteomics analysis. One hundred and one proteins were clearly identified and annotated. D shows the percentage of proteins at different subcellular locations. Others indicates locations at the proteasome, centrosome, or microtubules. Unknown membranes indicates that membrane location is predicted based on sequences, but the actual location is not known. E shows the potential functions of the identified proteins. Others indicates functions in immunity, angiogenesis, respiration, and microtubule nucleation. See supplemental Table S1 for details.

