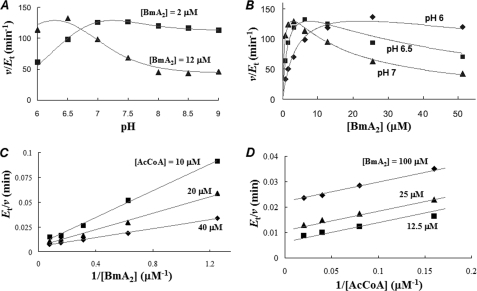
FIGURE 2.
Enzyme kinetic study of BAT. A, catalytic activity of BAT versus pH. The Bm-acetylating activity was measured in the presence of the given concentration of BmA2 (2 or 12 μm) under the saturated concentration of AcCoA (400 μm). B, catalytic activity of BAT versus the concentration of BmA2. The assay of BAT activity was conducted under the given pH values (6.0, 6.5, and 7.0) in the presence of 400 μm AcCoA. C, initial velocity pattern of BAT. The catalytic activity at pH 6 was obtained at the given concentrations of BmA2 (from 0.8 to 12.8 μm) with several fixed concentrations of AcCoA of 10, 20, and 40 μm. D, uncompetitive substrate inhibition by BmA2 with respect to AcCoA. The catalytic activity at pH 6.5 was obtained at the given concentrations of AcCoA (from 3.13 to 50 μm) with several fixed concentrations of BmA2 (12.5, 50, and 100 μm). Although each point in this figure corresponds to experimental data, the curves and lines are theoretically drawn.

